Introduction
Since attending a frontend conference last week, I have gained some new insights into new technologies in frontend development. One of them is about Chrome local code debugging. So, I want to make a simple record here. First, let me share a link: youtube-ChromeDevs
I would like to express my gratitude to the Chrome DevTools team for their excellent work. However, before the frontend conference by jecfish, I was not aware of so many friendly web debugging tools and performance testing methods. So, I will make a simple record here. If you are interested, you can check out the link above, which contains a lot of useful information. Feel free to show your support to their team.
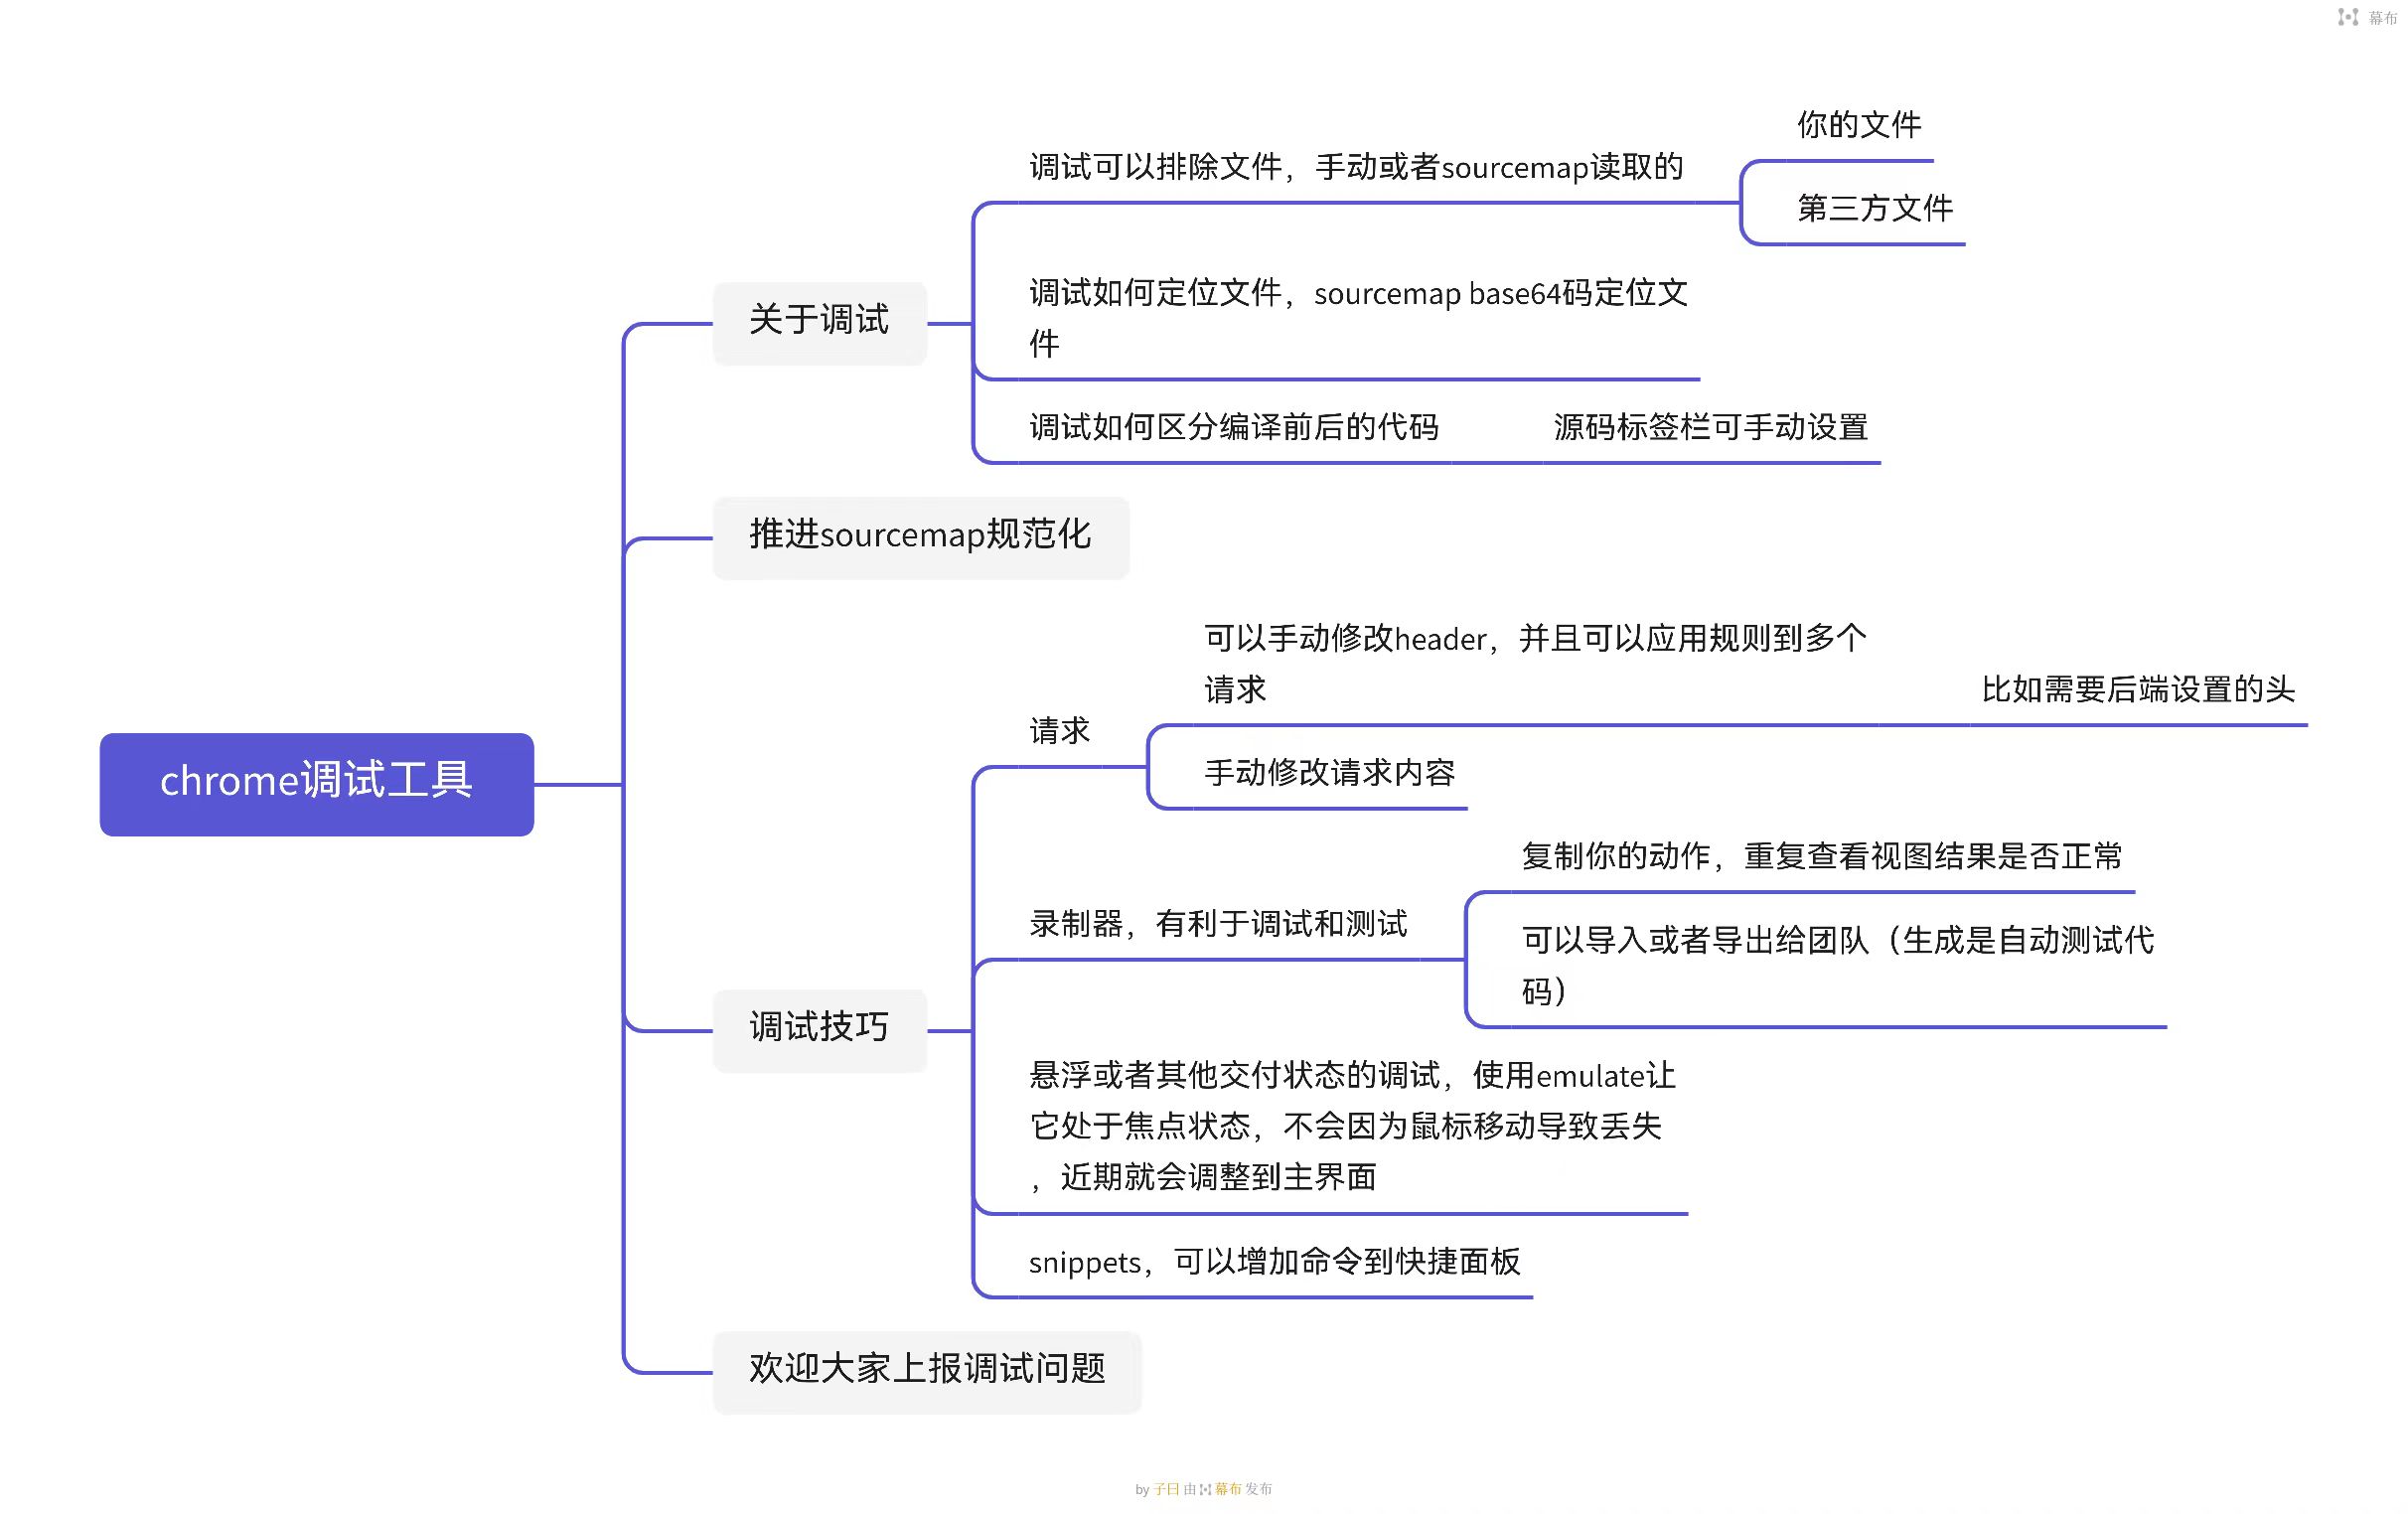
Below is the outline of this chapter, which will be further elaborated.
Local Code Debugging
This section will cover local code debugging, mainly focusing on the topic of source maps. I will provide some brief introductions and examples.
The Need for Source Code Mapping
Here is a link: source-map
This link contains some content about source maps written by jecfish. If you are interested, you can check it out. If the article is too long for you, you can directly read the content below.
Today, we are going to discuss source code mapping, an important tool in modern web development that greatly simplifies debugging work. In this article, we will explore the basics of source code mapping, how source code mapping is generated, and how it improves the debugging experience.
Before diving into the study of source maps, we need to have a basic understanding of Modern Web. So, what should we talk about when I mention Modern Web?
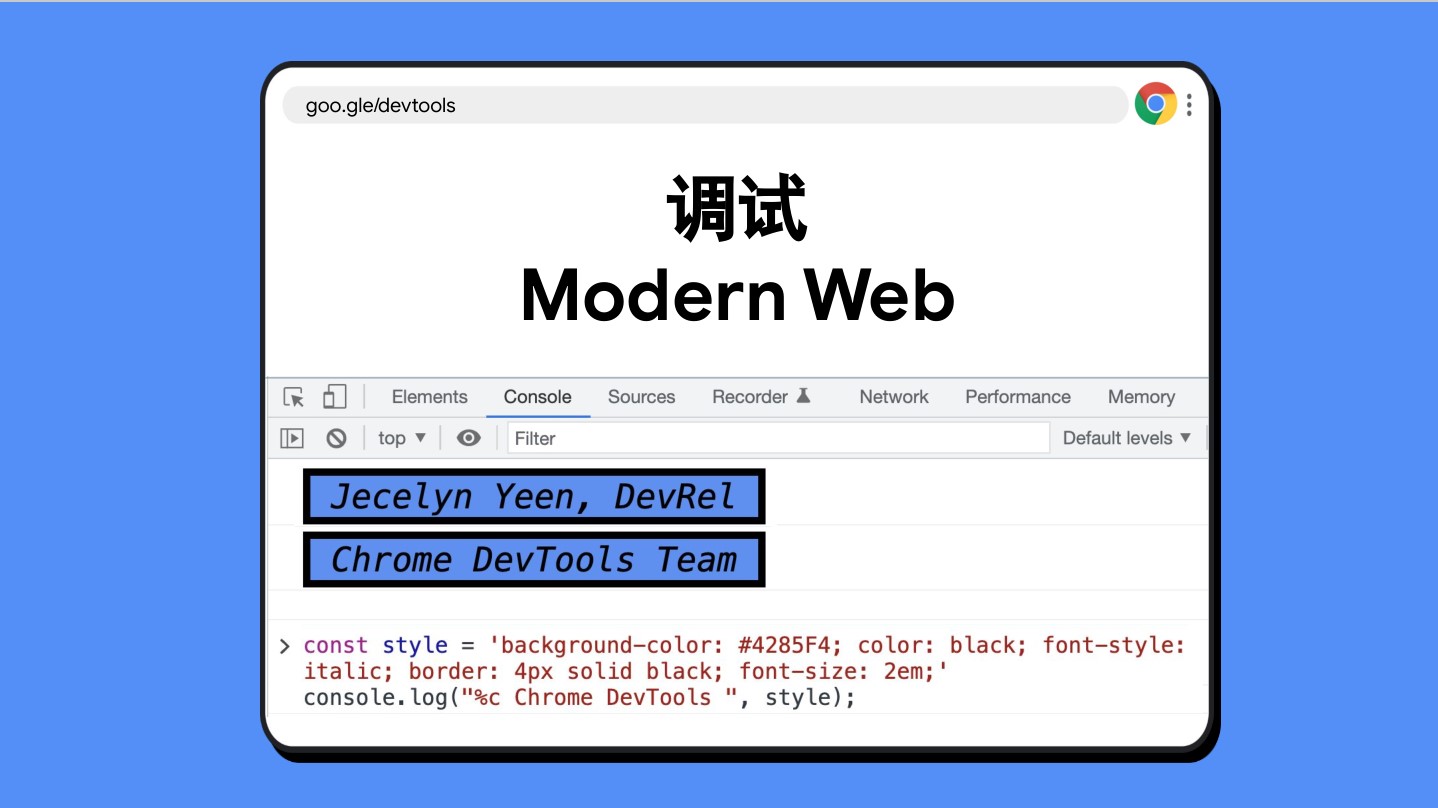
We can see that the console prints some content related to BaseOn CSS styles. Although we are not going to focus on the CSS styles of the console today, you can still define some styles to make your console output more beautiful!
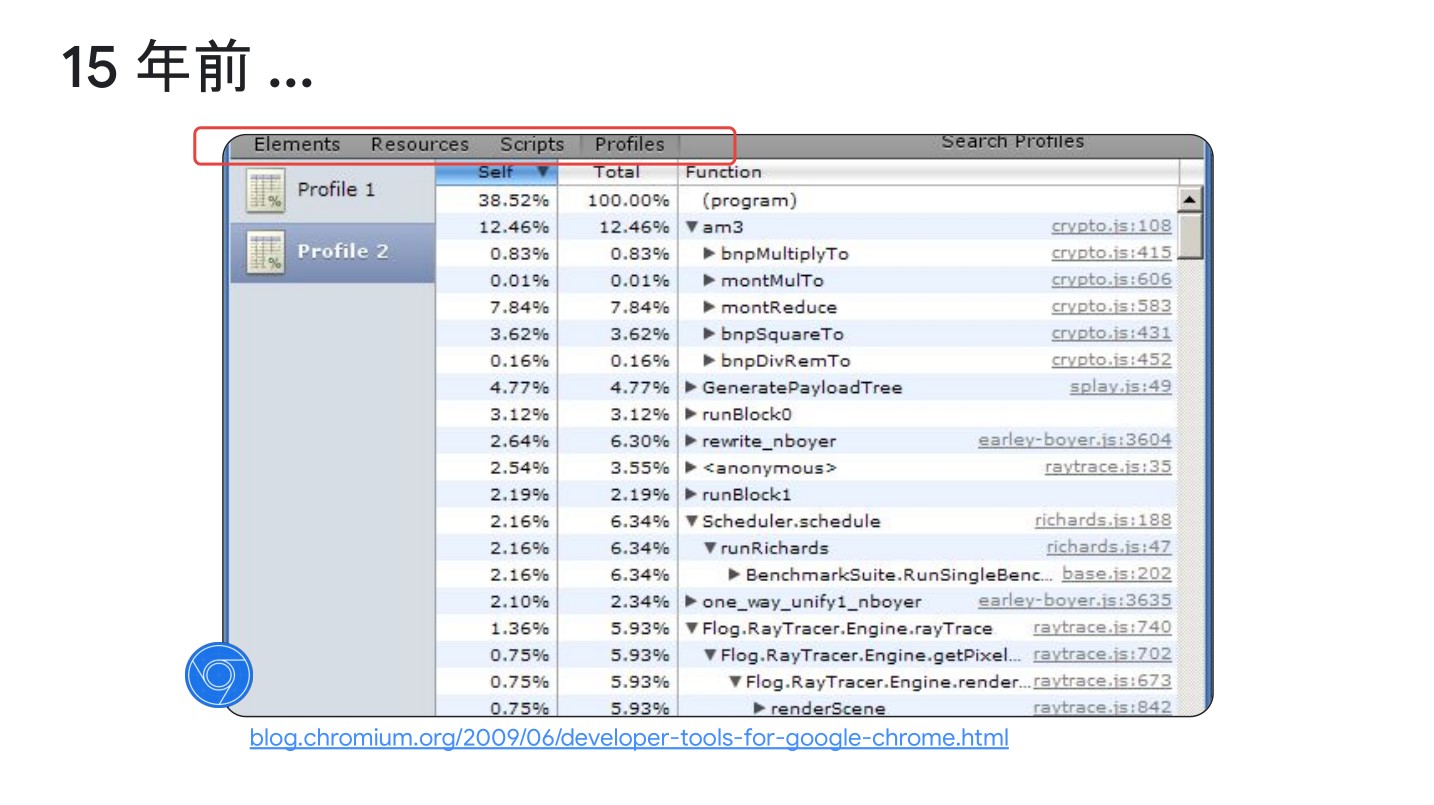
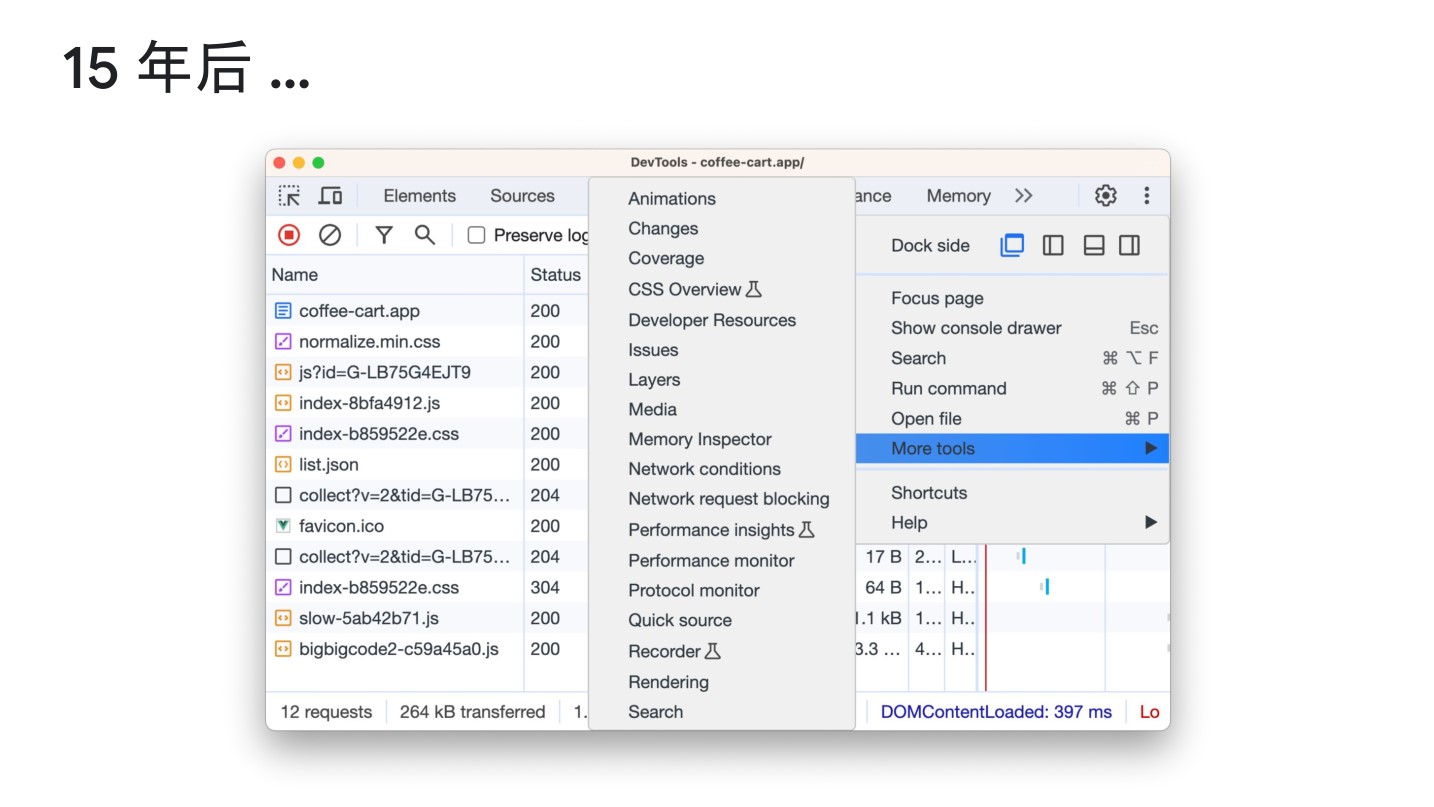
After 15 years, we can see that the debugging tools in the Chrome DevTools have evolved from a few options to a rich and diverse set of tools. The changes have been significant. So, today, let’s talk about the specific applications of these 32 debugging tools in Chrome.
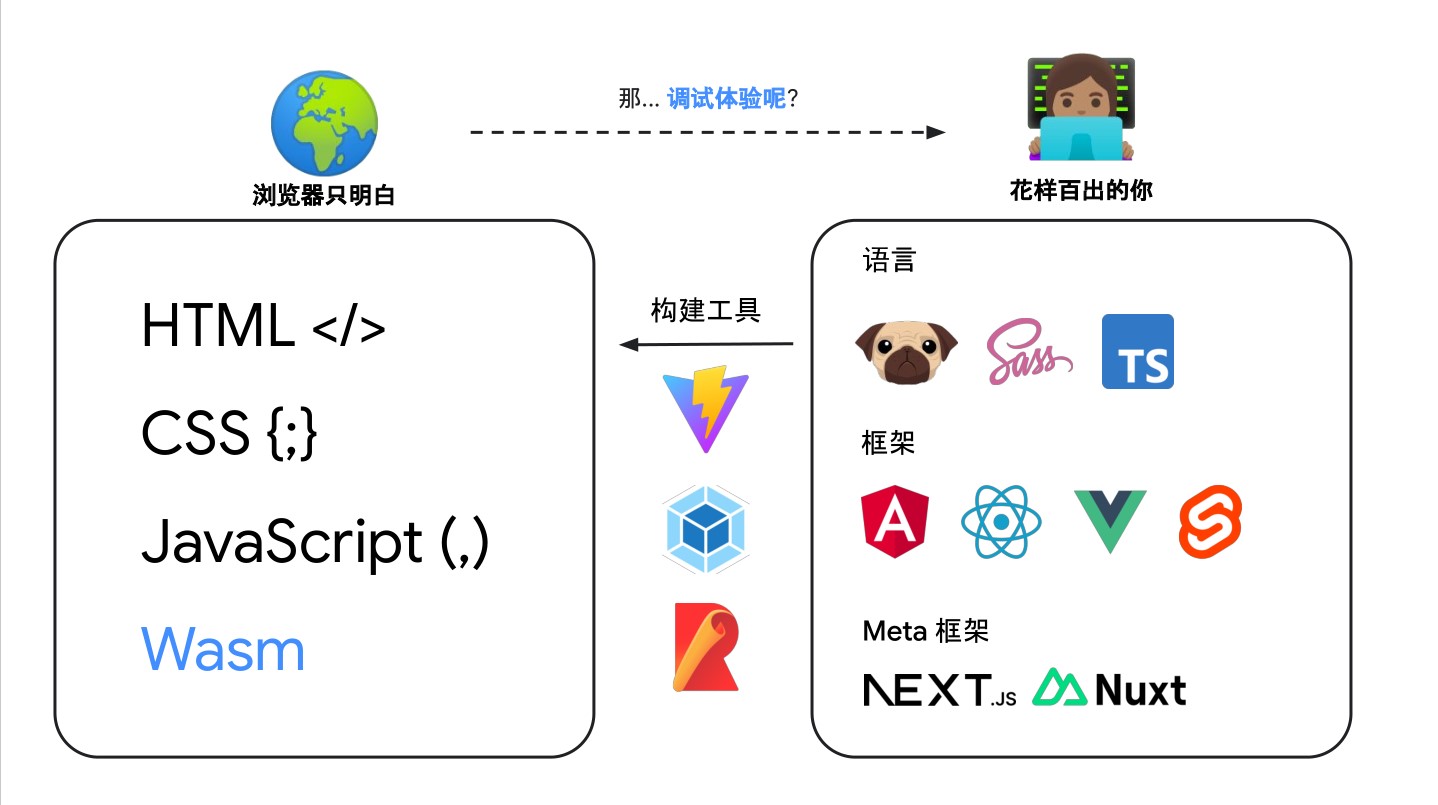
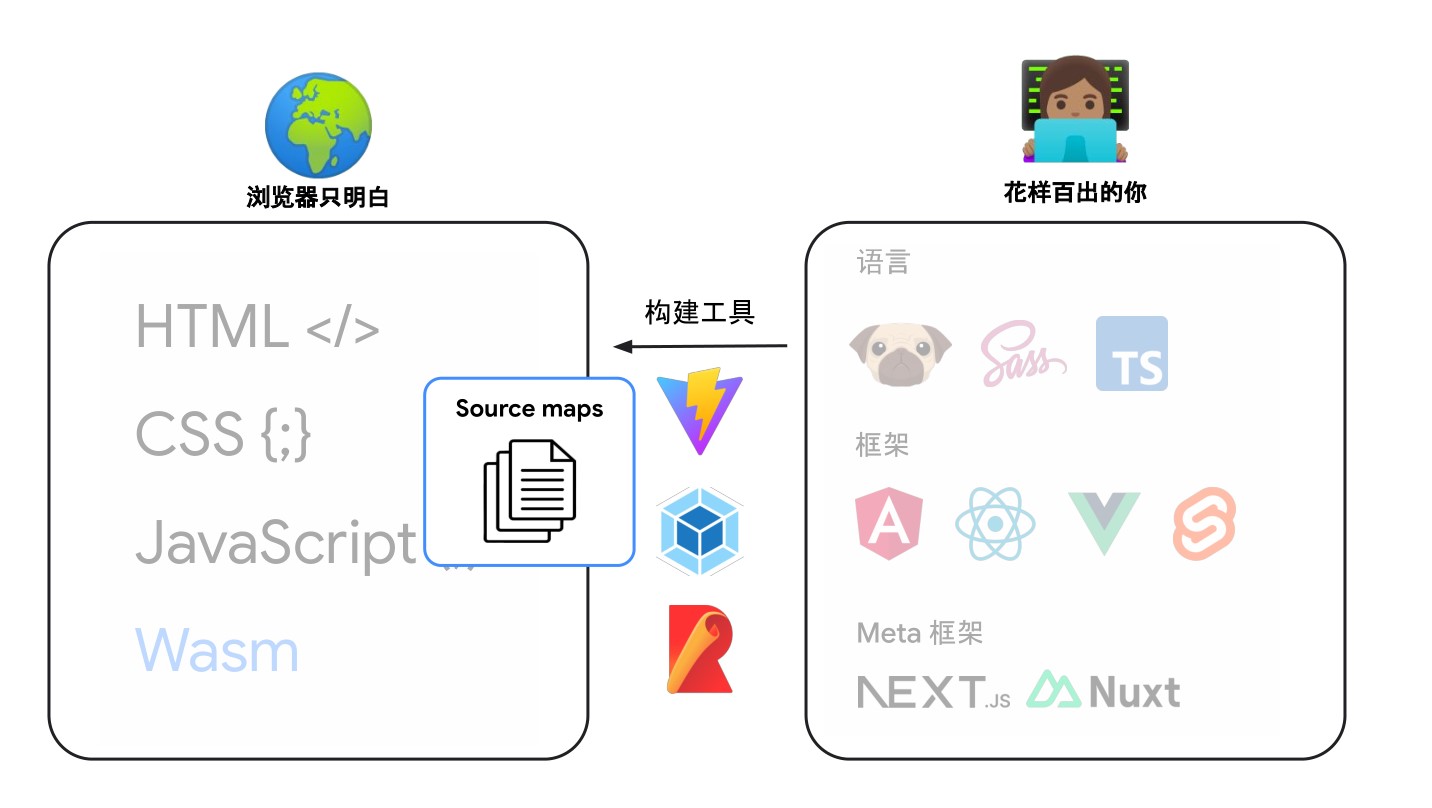
We know that browsers only understand a few languages: HTML </> CSS {;} JavaScript (,) Wasm (of course, modern browser engines now have built-in support for Wasm modules by default). However, our frontend frameworks are extremely rich, involving languages such as TypeScript, Less, Sass, and frameworks such as Vue, React, and meta frameworks such as Nust.js, Next.js. These frameworks are used in our frontend code, but browsers do not understand these languages. Therefore, we need to convert these languages into languages that browsers can understand.
We are building more complex web applications, and your development workflow may involve the use of various tools. For example:
- Template languages and HTML preprocessors: Pug, Nunjucks, Markdown.
- CSS preprocessors: SCSS, LESS, PostCSS.
- JavaScript frameworks: Angular, React, Vue, Svelte.
- JavaScript meta frameworks: Next.js, Nuxt, Astro.
- Advanced programming languages: TypeScript, Dart, CoffeeScript.
And more. The list keeps growing!
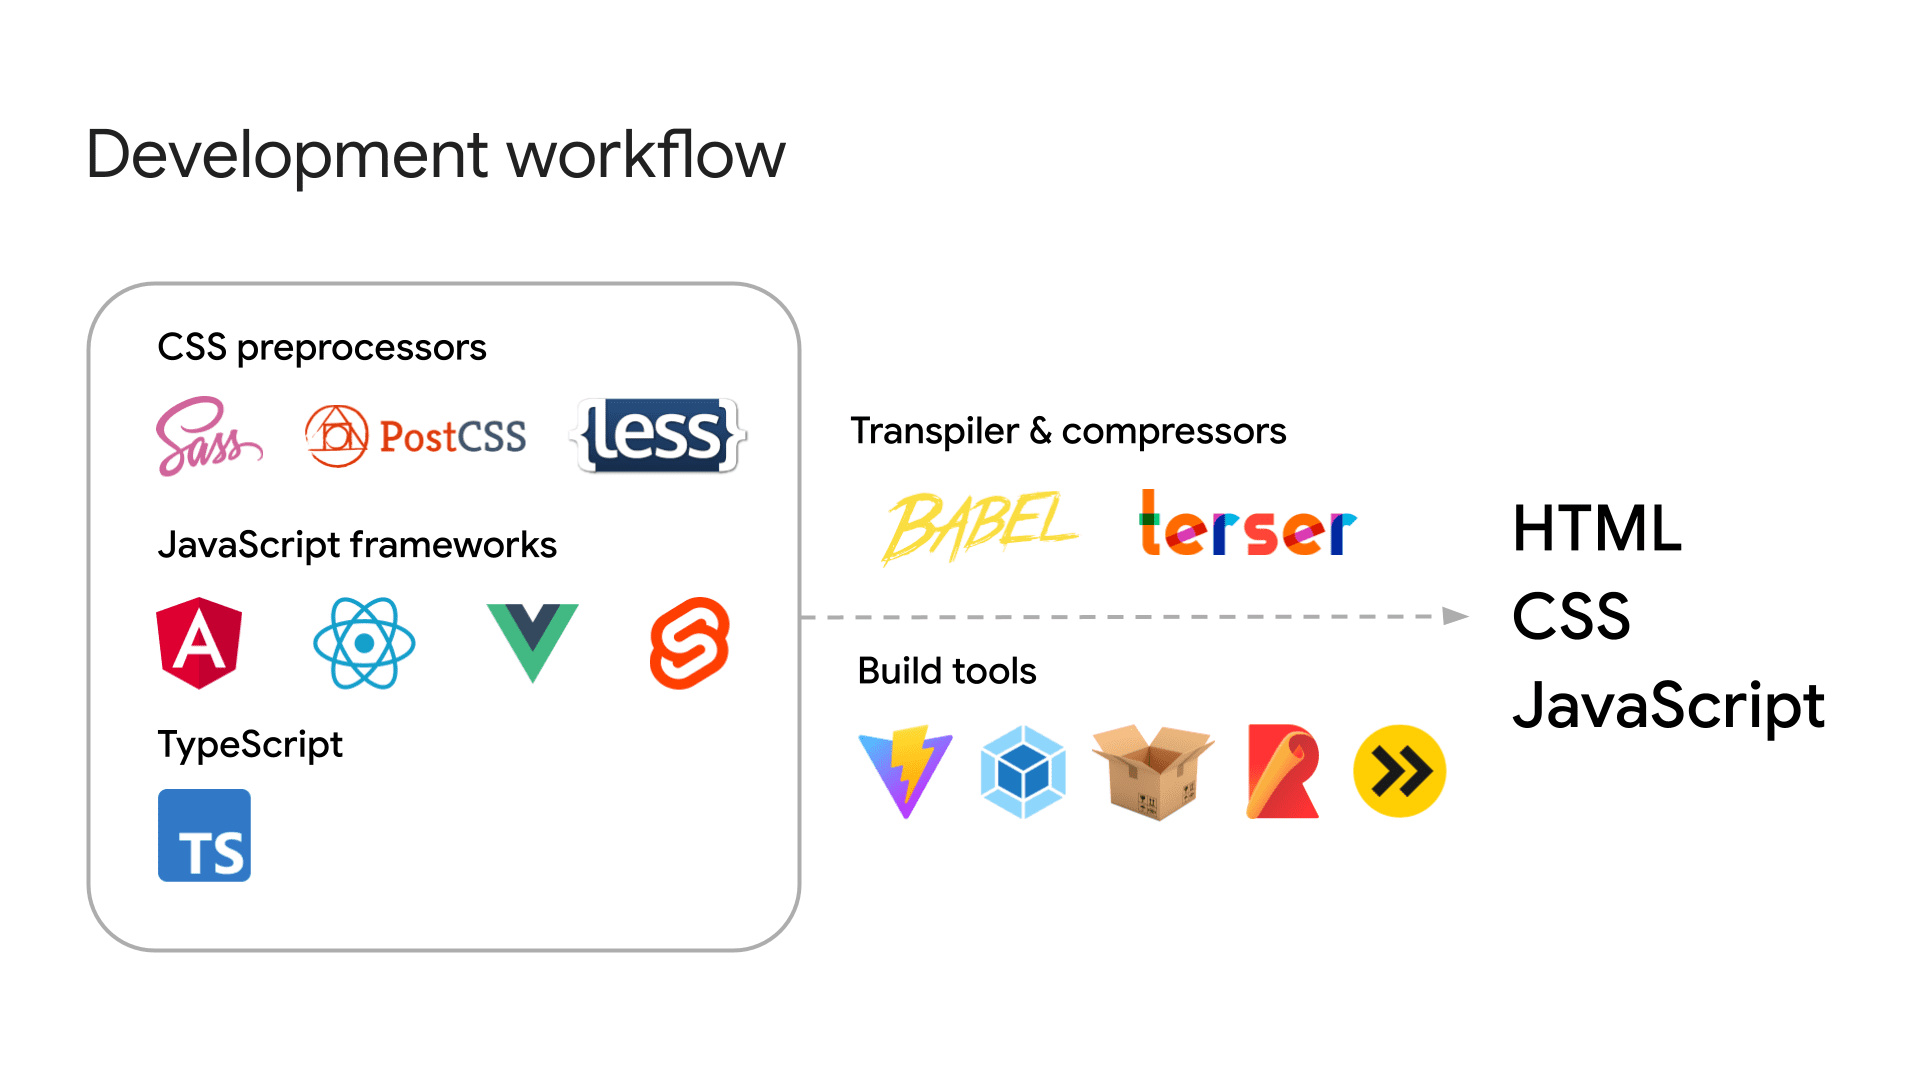
These tools require a build process to transpile the code into standard HTML, JavaScript, and CSS that browsers can understand. Additionally, for performance optimization, it is common practice to minify (e.g., using Terser to reduce and obfuscate JavaScript) and concatenate these files to reduce their size and improve web efficiency.
During the process of converting these various template languages, preprocessors, and meta frameworks into HTML, JavaScript, and CSS that browsers can understand, there is a compilation process that generates some intermediate code. This intermediate code is our source code mapping, which is what we are going to talk about today.
For example, using a build tool, we can transpile and minify the following TypeScript file into a single line of JavaScript. You can find this demo on GitHub: parcel-demo
/* A TypeScript demo: example.ts */

document.querySelector('button')?.addEventListener('click', () => {
  const num: number = Math.floor(Math.random() * 101);
  const greet: string = 'Hello';
  (document.querySelector('p') as HTMLParagraphElement).innerText = `${greet}, you are no. ${num}!`;
  console.log(num);
});
Certainly! Below is the English translation of the provided content:
/* A compressed JavaScript version of the TypeScript demo: example.min.js */

document.querySelector("button")?.addEventListener("click", (() => {
    const e = Math.floor(101 * Math.random());
    document.querySelector("p").innerText = `Hello, you are no. ${e}!`;
    console.log(e);
}));
However, this optimization increases the difficulty of debugging. If compressed code puts everything in a single line and uses short variable names, it becomes challenging to trace the root of the problem. This is where source maps come into play—they map the compiled code back to the original code.

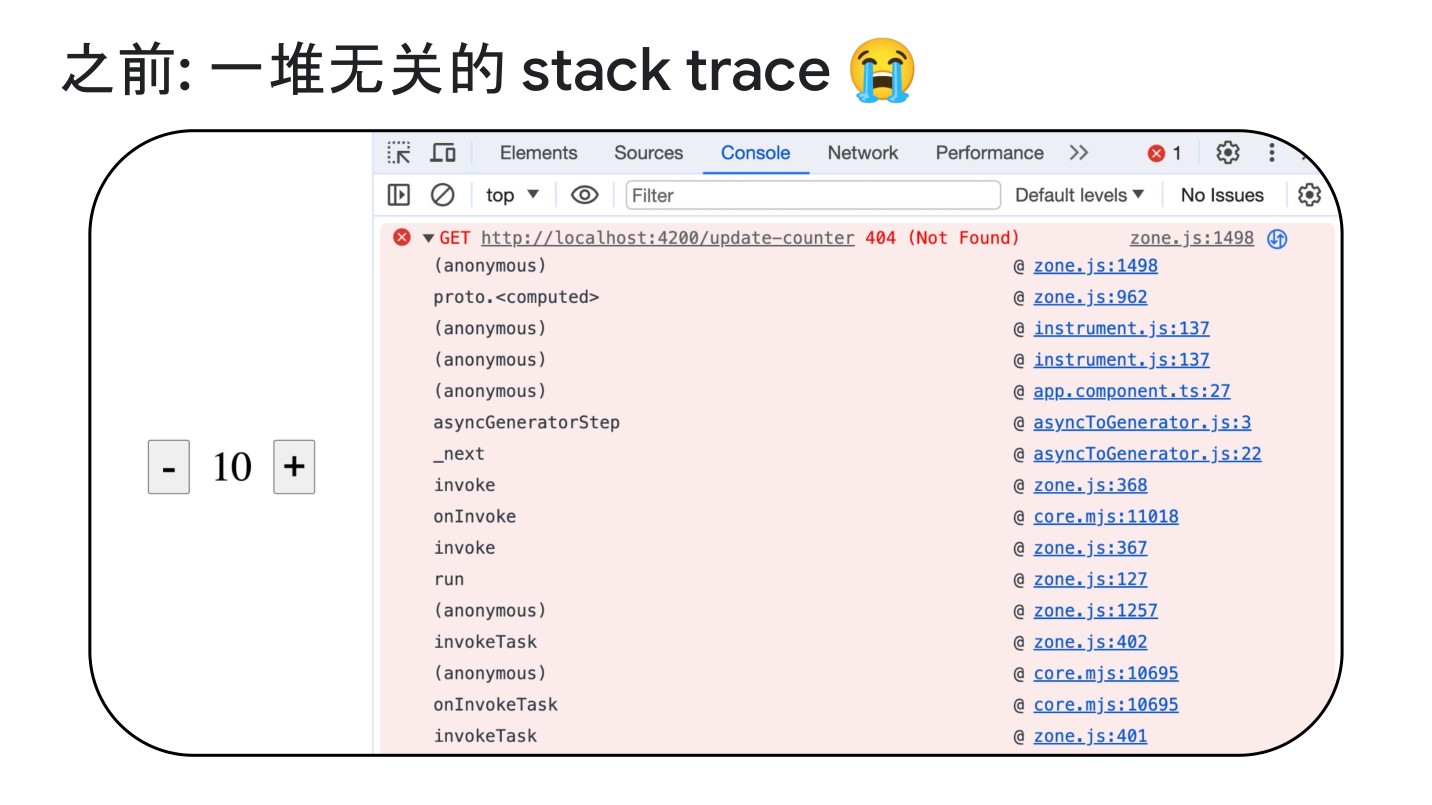
Now let’s look at a specific example. This example is a simple click event triggering an XHR written in TypeScript, where a 404 error is reported.
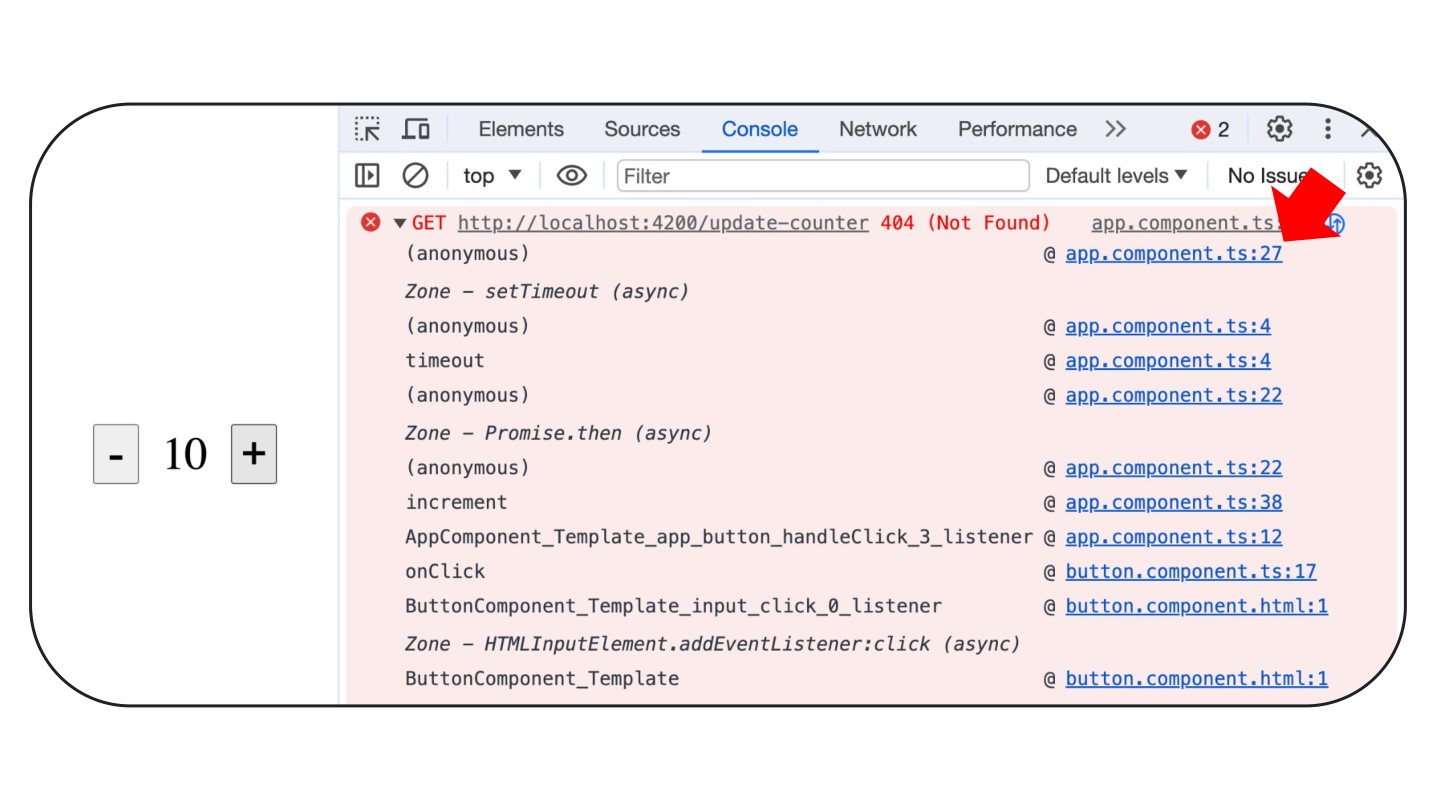
Oh? What’s happening here? Pay attention to the red arrow; it seems like our browser understands TypeScript code?
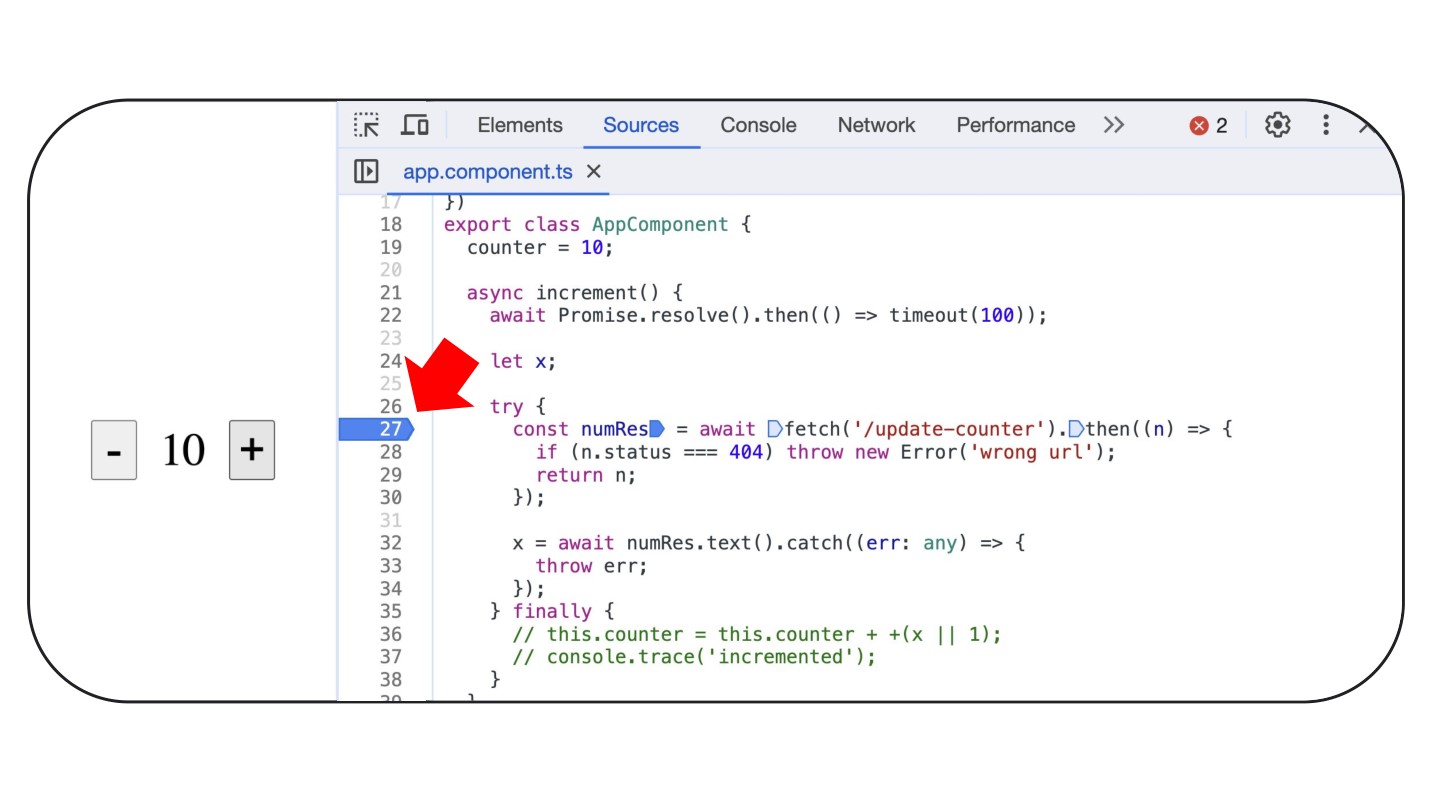
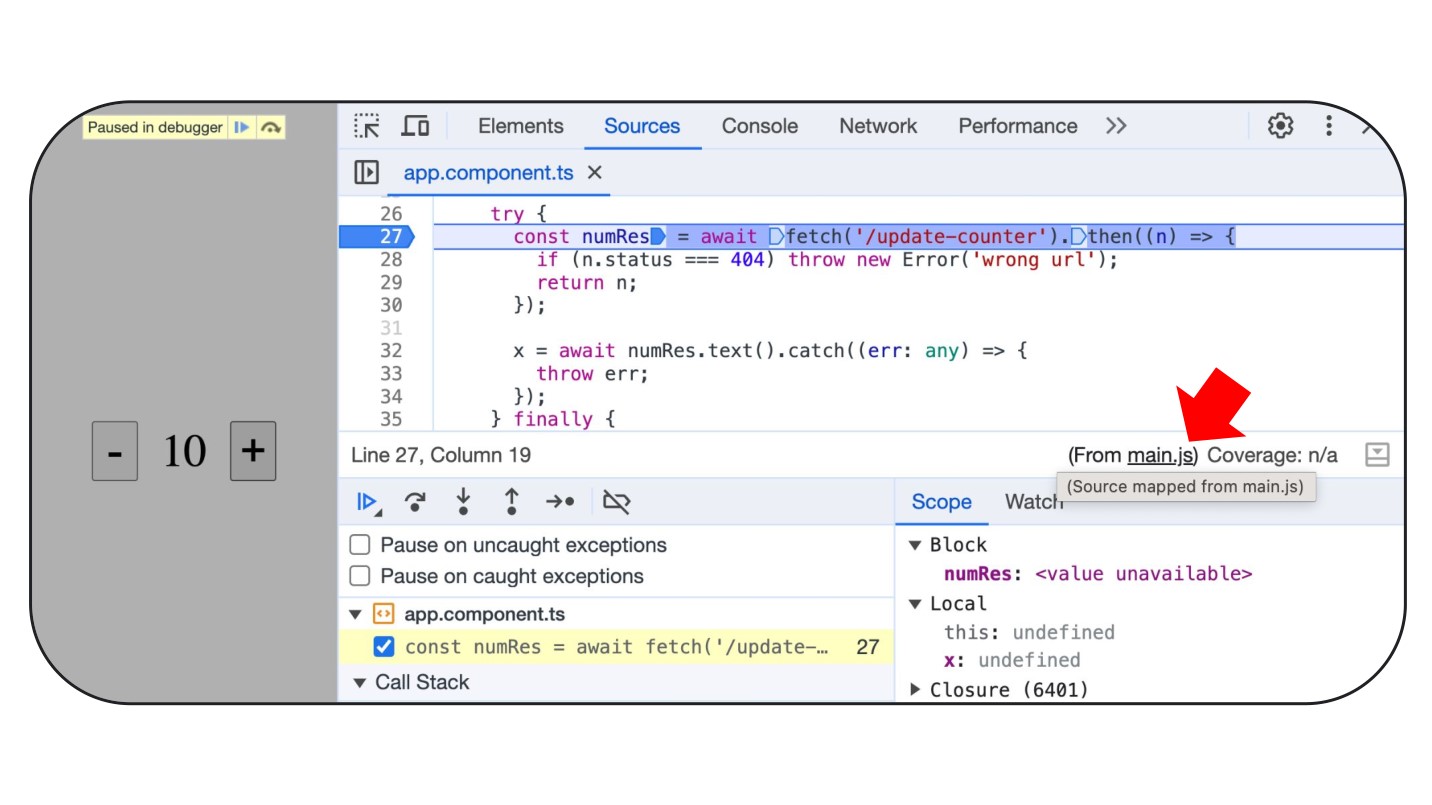
Actually, it’s not the case. Looking at this image, it appears that TypeScript is parsed from main.js.
Understanding Source Code Mapping (source-map)
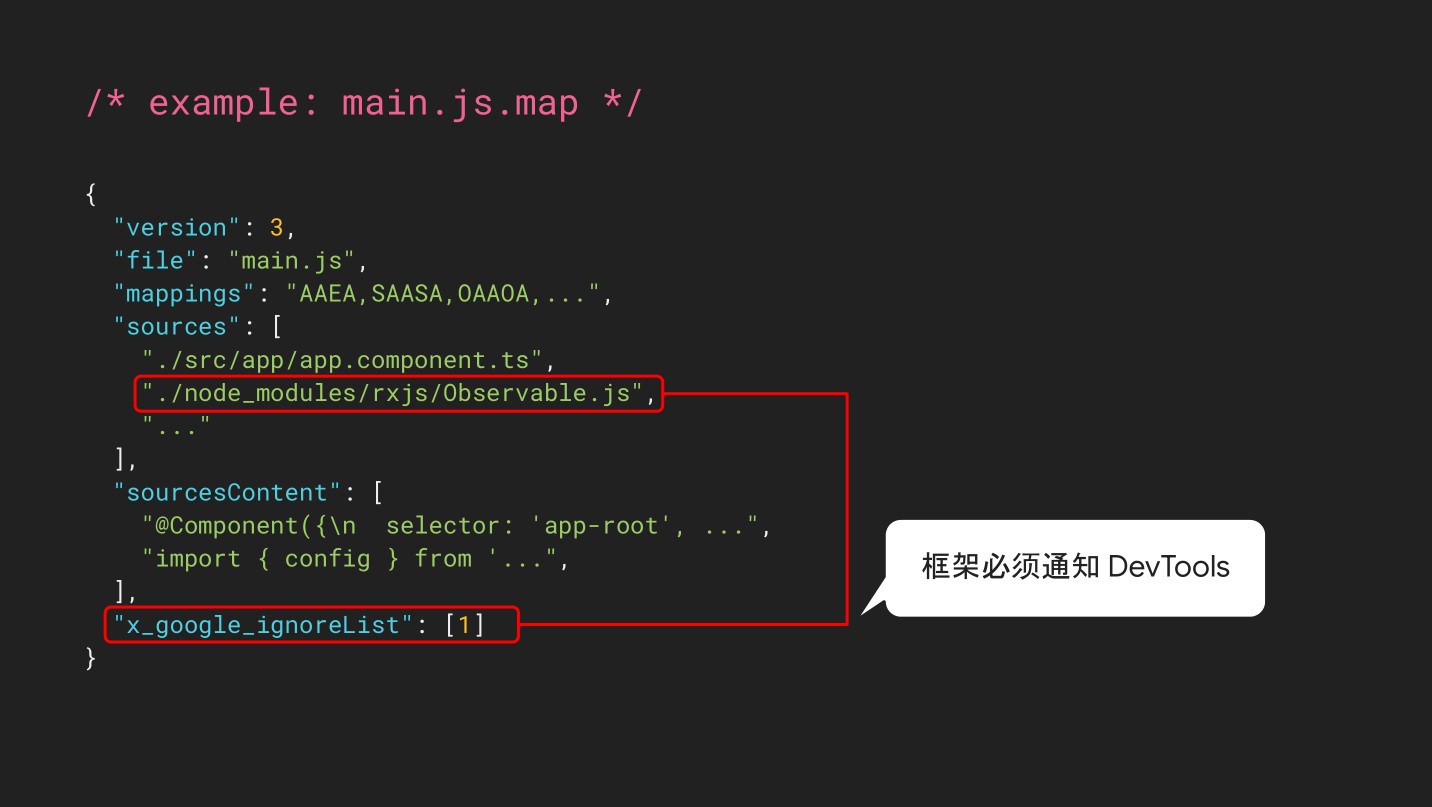
These source map files contain basic information about how the compiled code maps back to the original code, allowing developers to easily debug. Here’s an example of a source map:
{
  "mappings": "AAAAA,SAASC,cAAc,WAAWC, ...",
  "sources": ["src/script.ts"],
  "sourcesContent": ["document.querySelector('button')..."],
  "names": ["document","querySelector", ...],
  "version": 3,
  "file": "example.min.js.map"
}
To understand each field, you can read the Source Map Specification or this classic article on Anatomy of a Source Map.
The most crucial aspect of source maps is the mappings field. It uses VLQ base 64-encoded strings to map lines and positions in the compiled file to the corresponding original file. Source map visualization tools like source-map-visualization and Source Map Visualization can intuitively display this mapping.
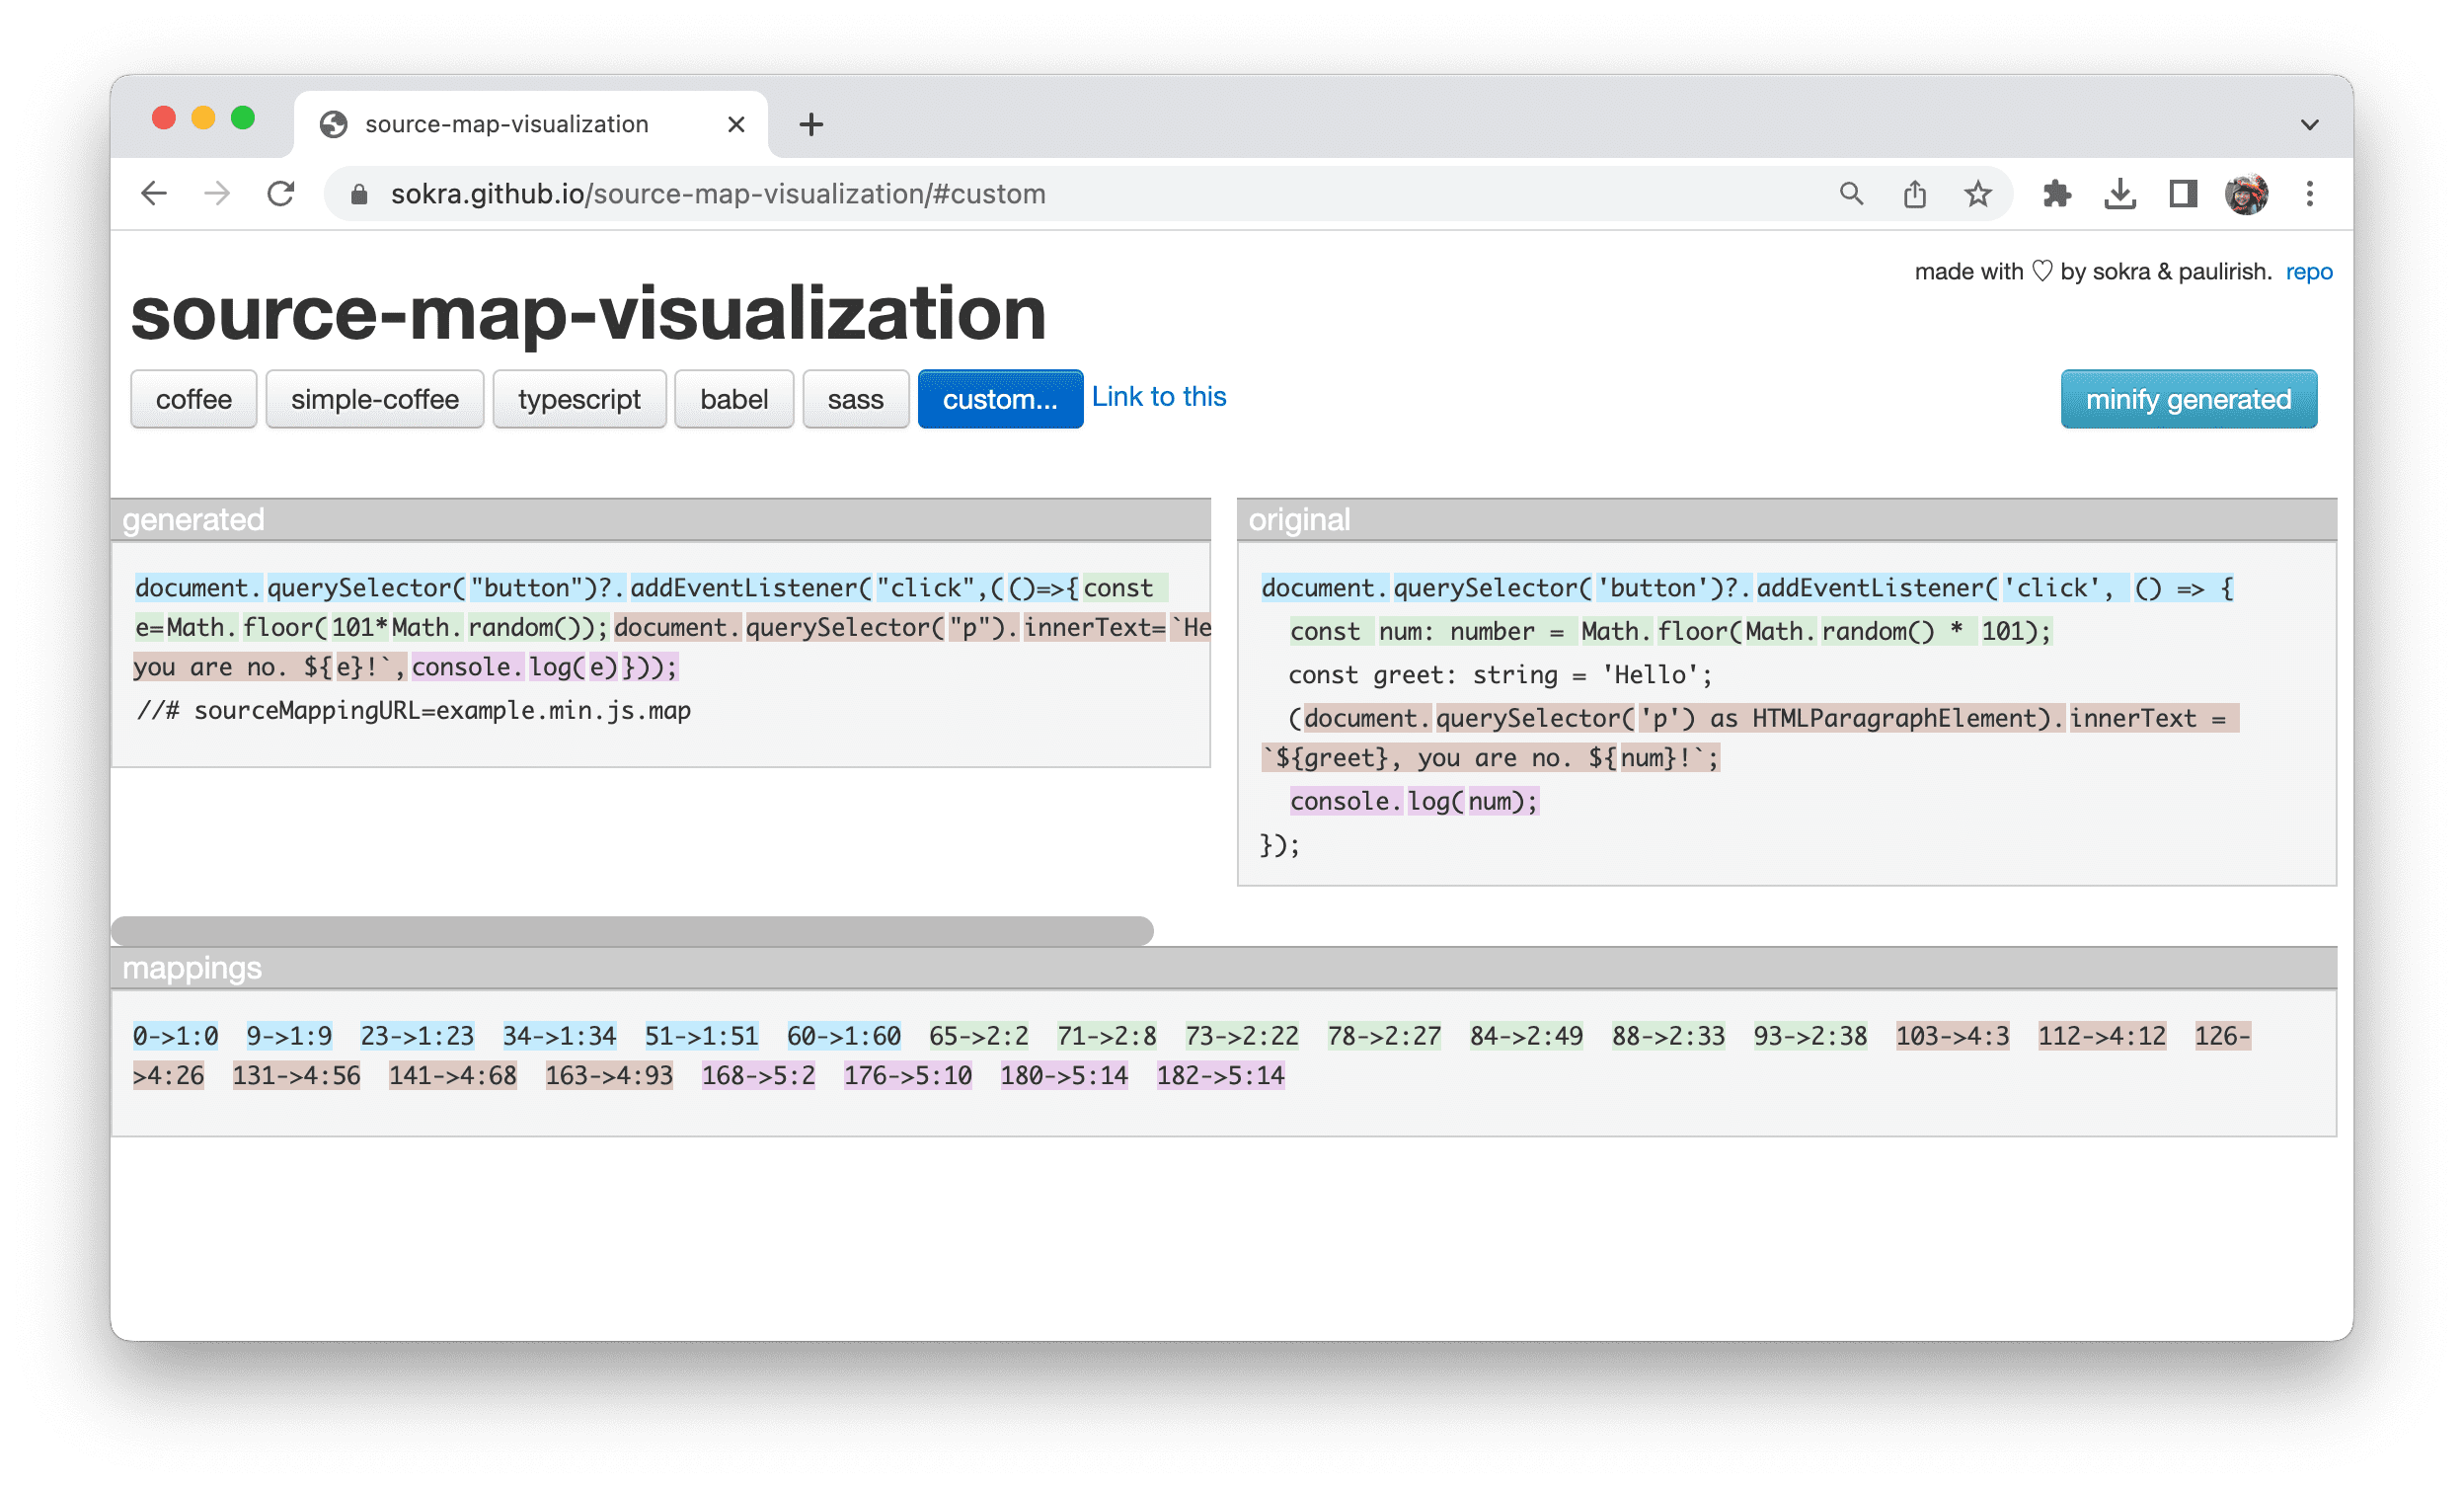
The left column represents the generated code, while the original column shows the original source.
Visualization tools color code each line in the original column and the corresponding code in the generated column.
The mapping section shows the decoded code mappings. For example, the entry 65 -> 2:2 means:
- Generated code: The word
constin the compressed content starts at position 65. - Original code: The word
conststarts at line 2, column 2 in the original content.
This way, developers can quickly identify the relationship between the minified code and the original code, making the debugging process smoother.
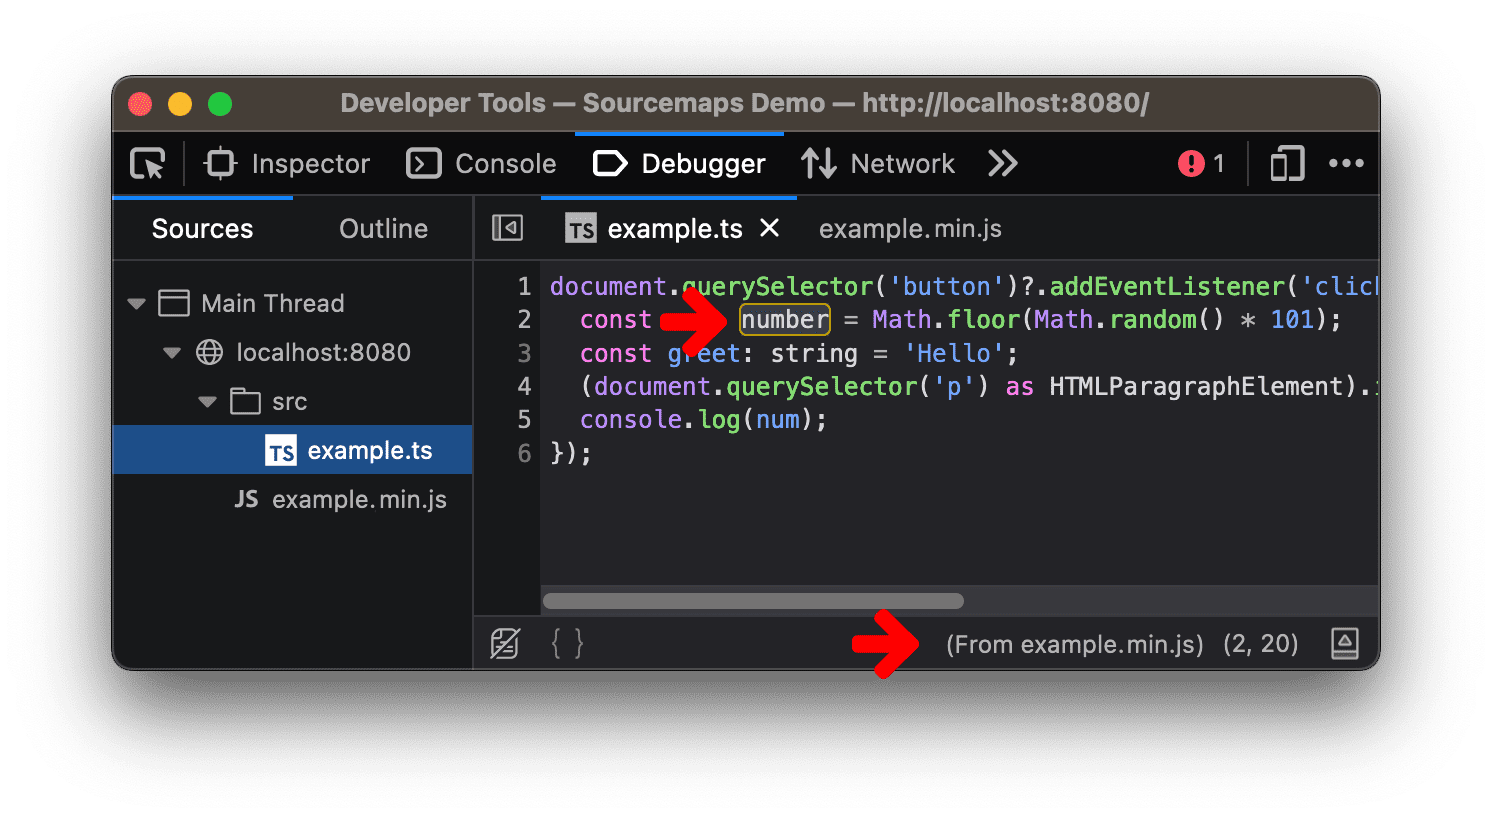
Browser developer tools apply these source code mappings, helping you pinpoint debugging issues directly in the browser.
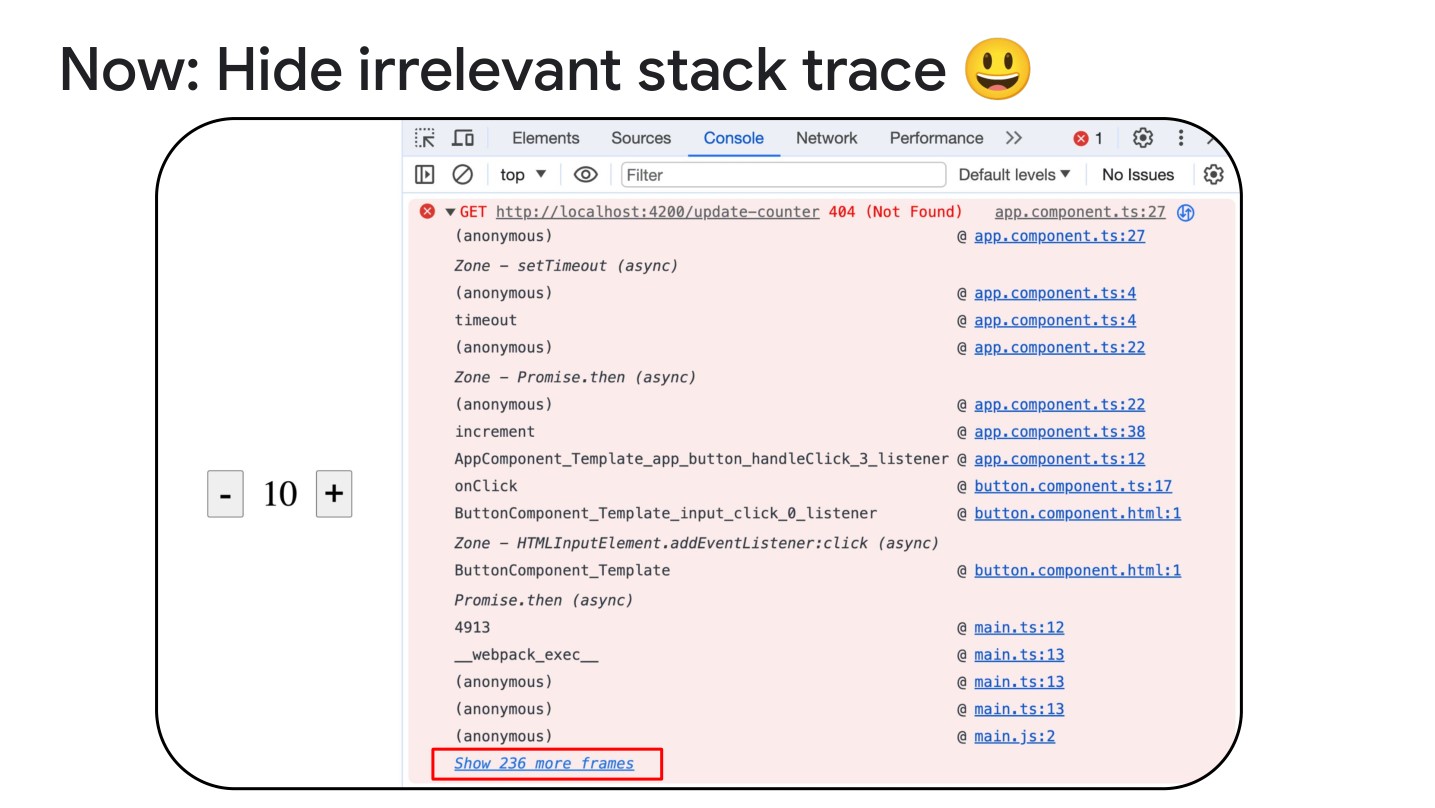
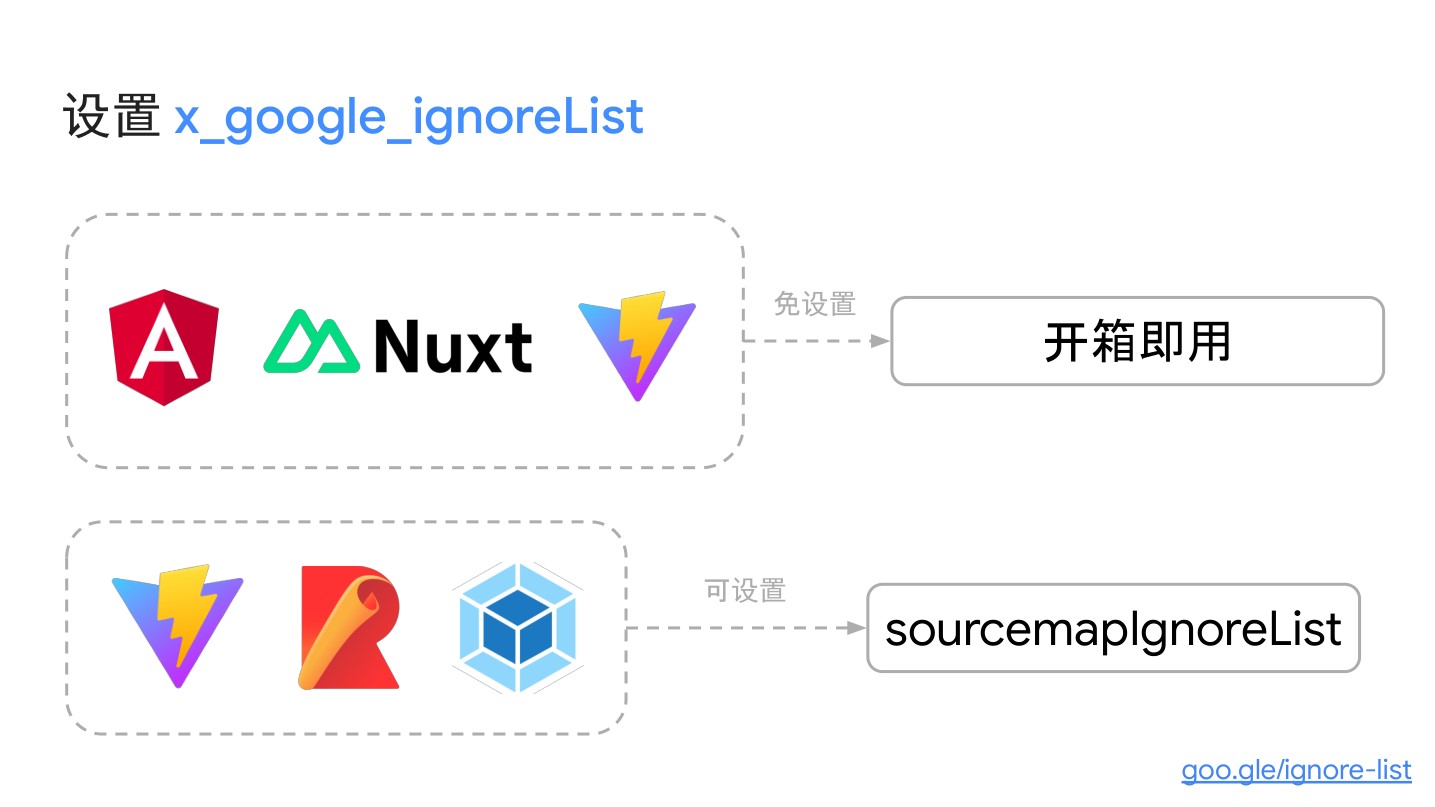
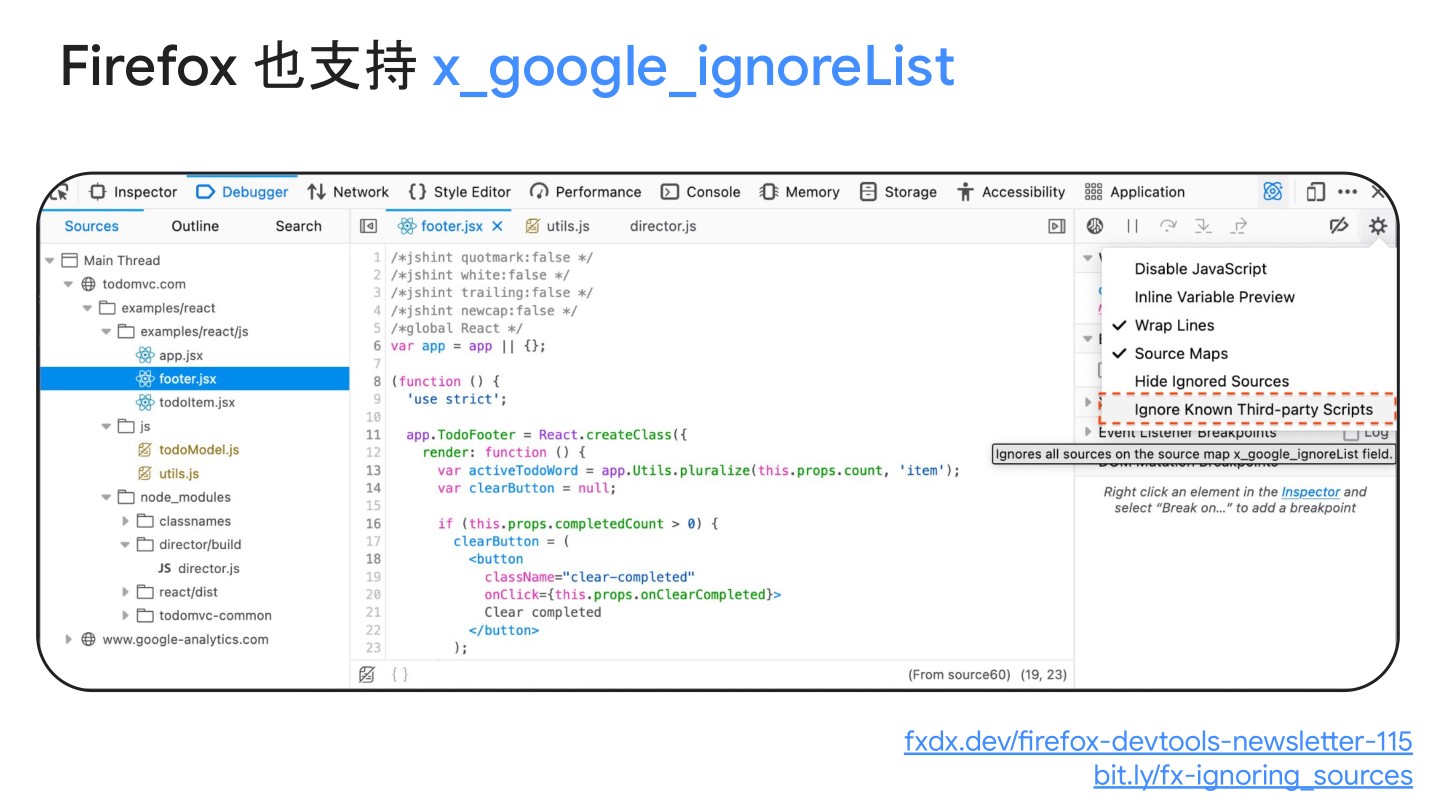
How DevTools Know What to Hide? Source Maps
Practical Chrome Debugging Tips
Requests
You can view detailed information about requests in the Network panel, including request headers, response headers, request body, response body, Cookies, Timing, and more.
Additionally, DevTools overrides allow you to simulate remote resources by overriding HTTP response headers and web content (including XHR and fetch requests) through local overrides. This enables you to prototype changes without waiting for backend support. Local overrides also let you retain changes made in DevTools during page load.
This is particularly useful in situations where frontend requests to the backend return results that haven’t undergone cross-origin handling (cross-origin handling is typically done on the backend). In such cases, even though the frontend receives correct data, the browser may mark the file as untrusted due to security policies. Local overrides allow you to simulate the backend’s response, facilitating frontend debugging.
Or, if some data on the backend hasn’t been modified yet, and the frontend receives outdated data, do we have to wait for backend engineers to fix the data before we can work on it? That seems a bit inefficient. Instead, we can use content rewriting through local overrides to simulate the modified data, allowing frontend debugging.
DevTools/overrides indeed is powerful. How does it work?
- When you make changes in DevTools, DevTools saves a copy of the modified file to a folder you specify.
- When you reload the page, DevTools provides the locally modified file instead of the network resource.
Overriding Web Content
Set Up a Folder
- Set up local overrides.
- Make changes to files and save them in DevTools.
For example, you can edit files in “Sources” or edit CSS in “Elements” > “Styles” unless the CSS is in an HTML file.
DevTools saves the modified files, listing them in Sources > Overrides, and displays them in related panels and panes, indicated by icons next to overridden files in Elements > Styles, Network, and Sources > Overrides.
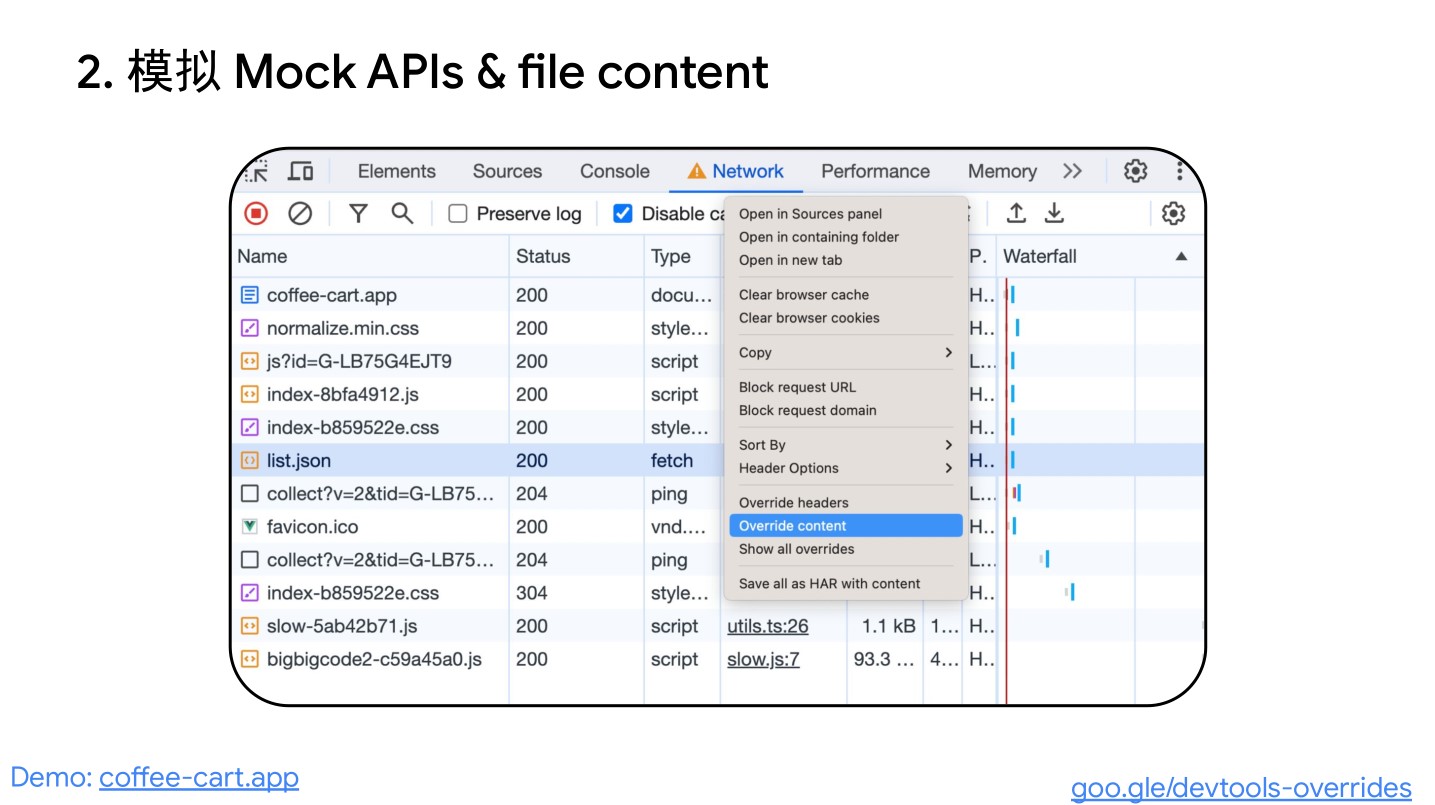
Override XHR or Fetch Requests to Simulate Remote Resources
With local overrides, you don’t need access to the backend, and you don’t have to wait for it to support your changes. Simulate and experiment instantly:
- Set up local overrides.
- In Network, filter XHR/fetch requests, find the desired request, right-click it, and choose “Override content.”
- Make changes to the fetched data and save the file.
- Refresh. Reload the page and observe the applied changes.
To understand this workflow better, watch the video here.
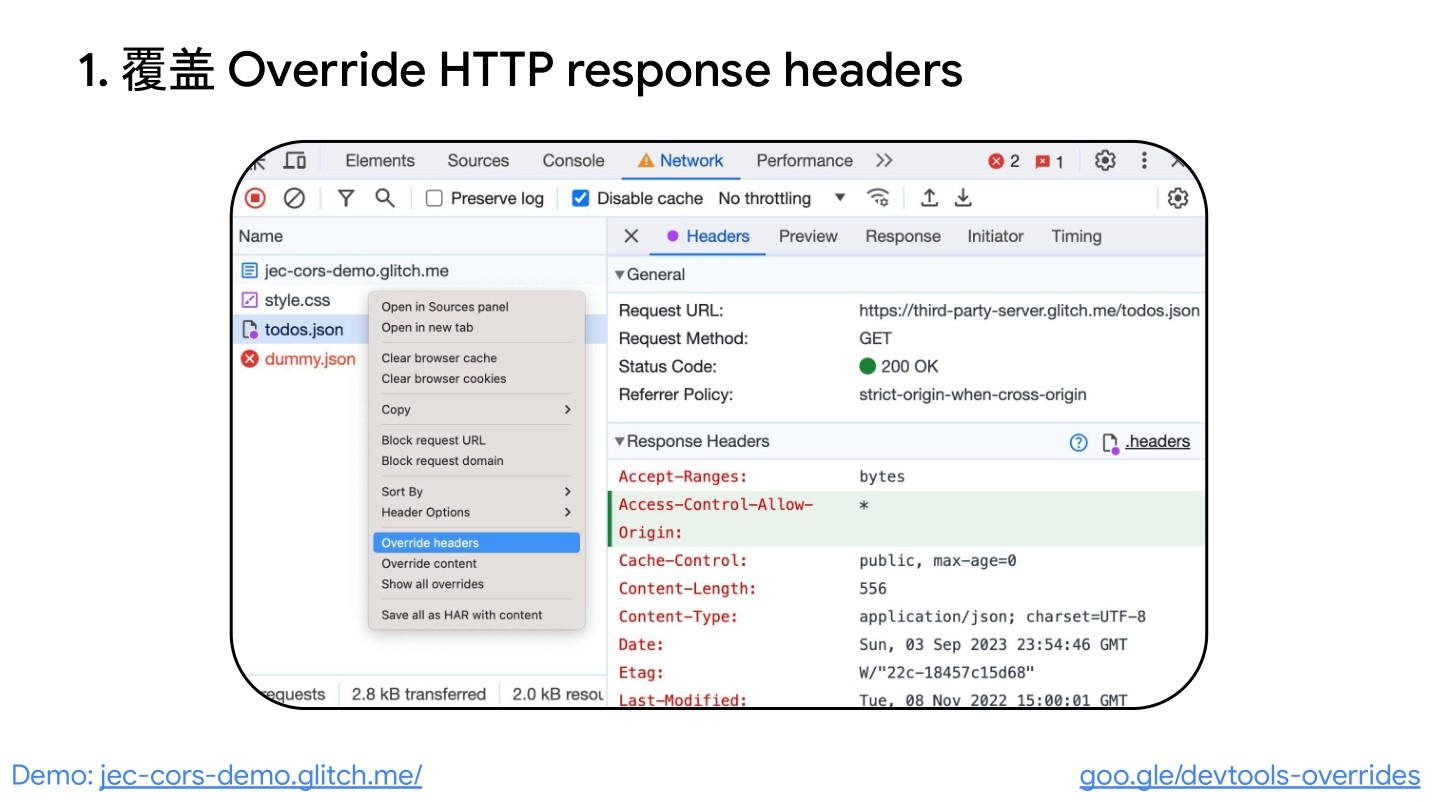
Override HTTP Response Headers
In the “Network” panel, you can override HTTP response headers without accessing the web server.
With response header overrides, you can prototype fixes for various headers, including but not limited to:
- Cross-Origin Resource Sharing (CORS) headers
- Permissions-Policy headers
- Cross-Origin Isolation headers
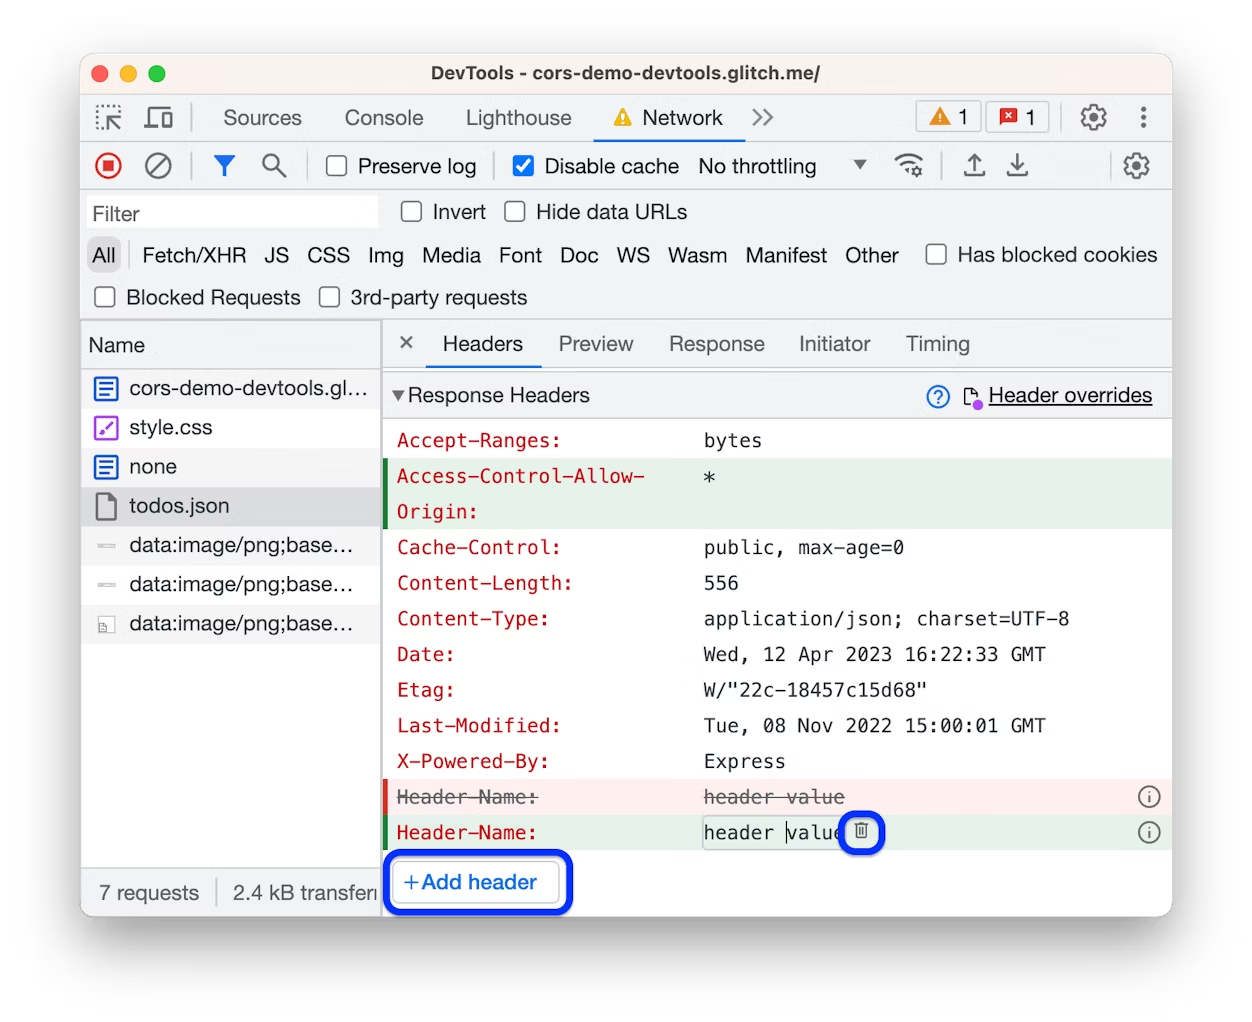
To override response headers:
- Set up local overrides and check.
- Go to Network, find the request, right-click it, and choose “Override headers.” DevTools will guide you to the **Headers
Response Headers Editor**.
Recorder, Beneficial for Debugging and Testing
Customize and automate user flows based on the Chrome DevTools Recorder for enhanced debugging and testing.
Writing automated tests might not be the most exciting part of a developer’s life. As developers, our focus is on functionality, fixing bugs, and improving the world! However, having automated tests in our workflow is crucial in the long run. So, we also recognize the importance of writing automated tests.
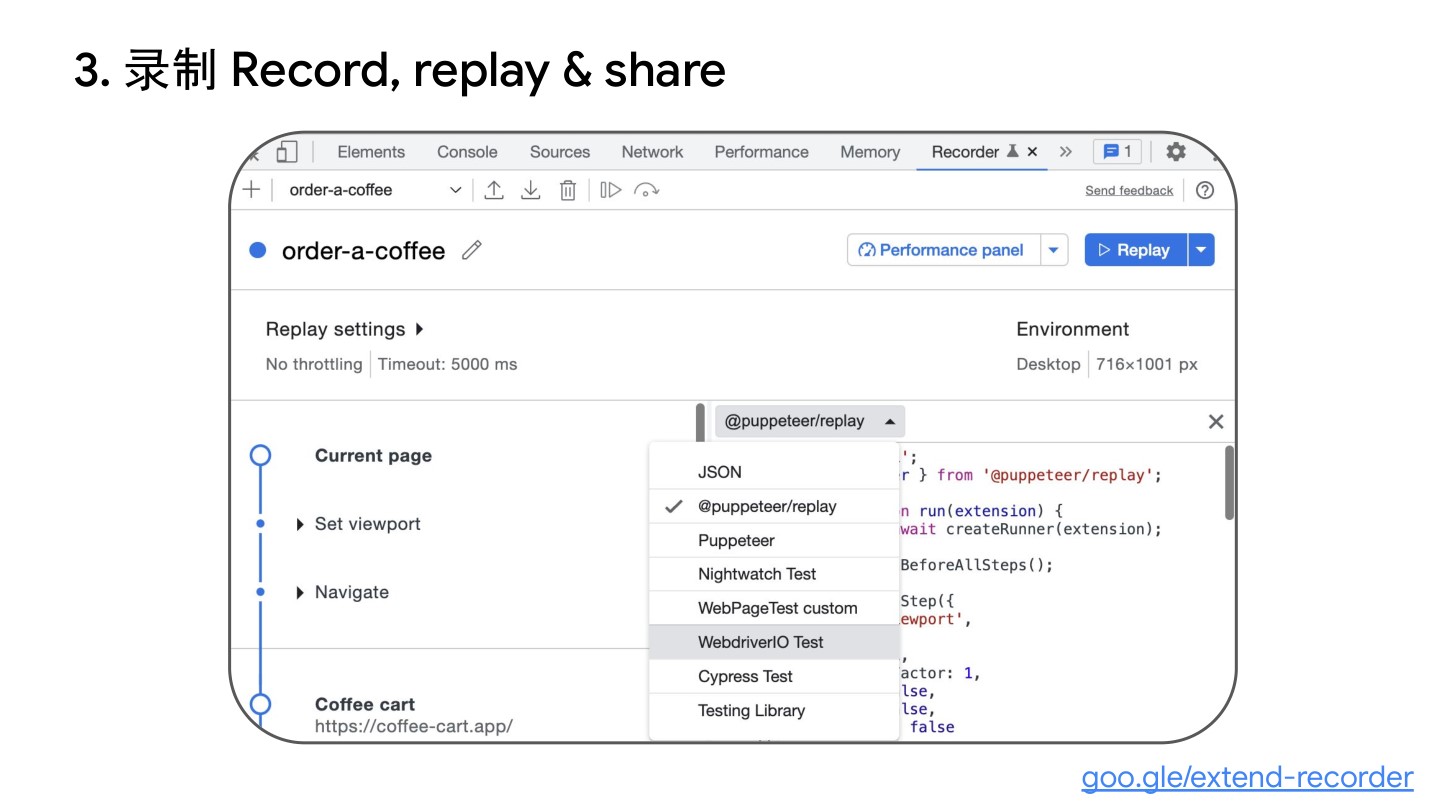
With the Chrome DevTools Recorder panel, you can record and replay user flows. You can export these flows in various formats (such as test scripts) using different third-party extensions and libraries. You can also customize user flows using the Puppeteer Replay library and integrate them into your existing workflow.
In this blog post, we’ll discuss:
- How to programmatically export and replay user flows.
- How to customize user flows with Puppeteer Replay.
- How to integrate with your CI/CD workflow.
Watch the video for a practical demonstration.
Programmatically Exporting User Flows and Replaying
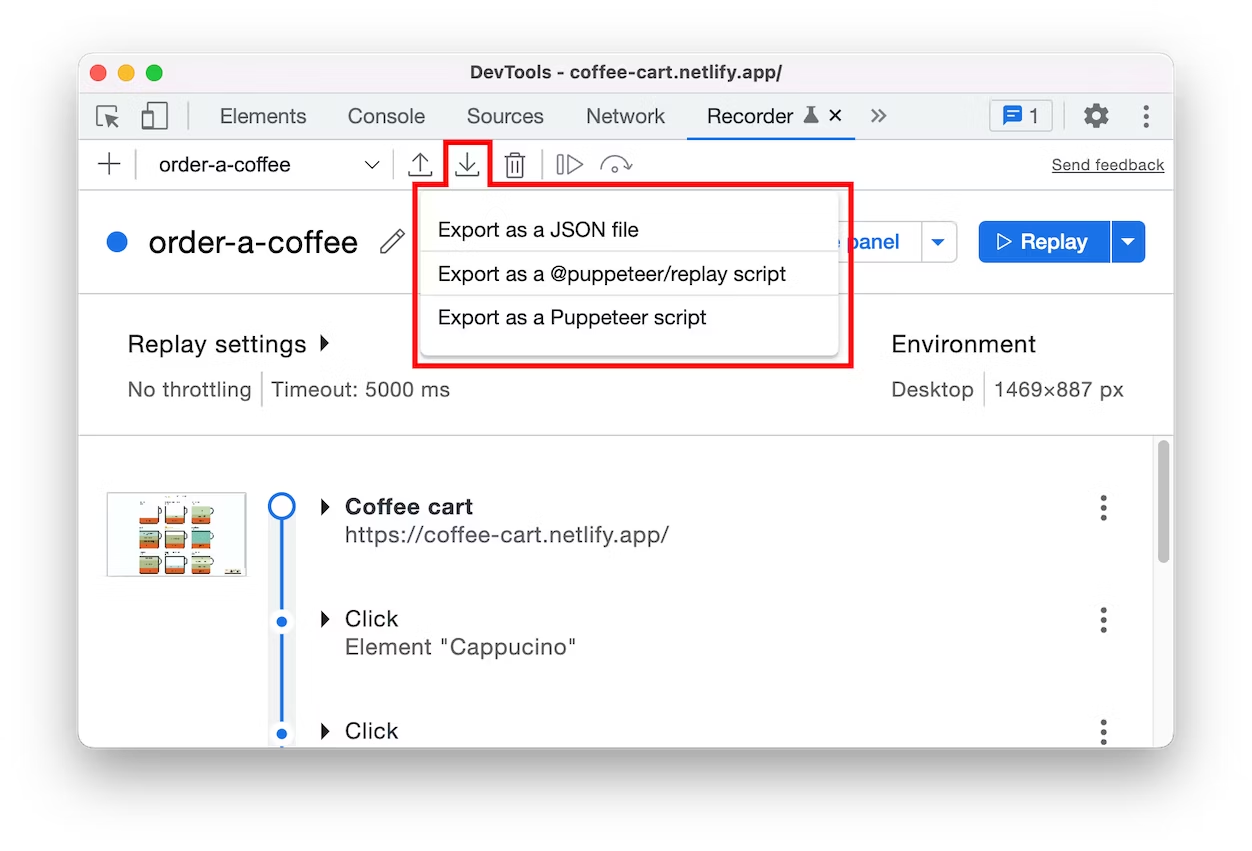
By default, the Recorder allows you to export recordings as Puppeteer or Puppeteer Replay scripts or as pure JSON files.
Replaying with Puppeteer Replay
After exporting the user flow as a JSON file, you have the option to import it back into the Recorder panel and replay it or use external libraries for replay. One such available library is Puppeteer Replay.

Puppeteer Replay is a library that helps you replay user flows. It’s based on Puppeteer and allows you to replay user flows in the browser without writing any code. You can use Puppeteer Replay to replay your user flows to ensure that your application performs well in different environments.
Integration with CI/CD Pipeline
There are various ways to achieve this, and several tools can be used. Here’s an example of automating this process using GitHub Actions:
# .github/node.js.yml

name: Replay recordings

on:
  push:
    branches: [ "main" ]
  schedule:
    - cron: '30 12 * * *' # daily 12:30pm

jobs:
  build:

    runs-on: ubuntu-latest

    steps:
    - uses: actions/checkout@v3
    - name: Use Node.js
      uses: actions/setup-node@v3
      with:
        node-version: 18.x
        cache: 'npm'
    - run: npm install puppeteer
    - run: npm run replay-all
    - run: npm run start
In this example, we replay the user flow under the following conditions:
- New changes are pushed to the main branch.
- Daily at 12:30 PM.
In addition to GitHub Actions, you can also integrate this with your preferred cloud provider.